Description:
Summary:
Skills Applied: Python, Inferential Statistics
Breakdown
1. Preprocessing

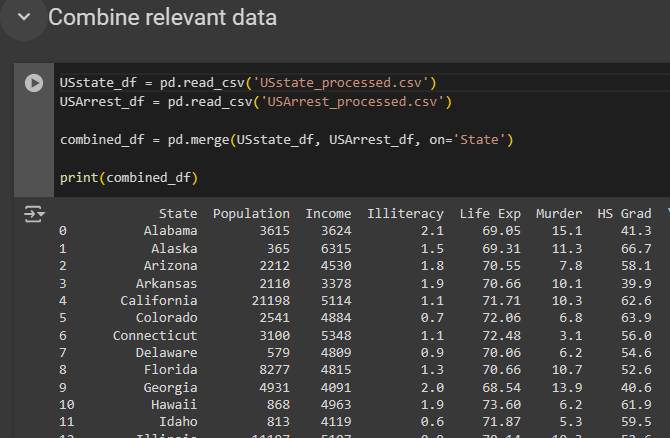
- In the initial stages of my project, I began by examining multiple csv files containing data on crime rates and demographics of various United States States and regions.
- Subsequently, I studied the data and identified the need for data preprocessing to ensure that the data is clean, before considering what dataframe to utilised for my analysis; dropping columns that are not needed, and changing variable names to a much more suitable name.
2. Feature Engineering

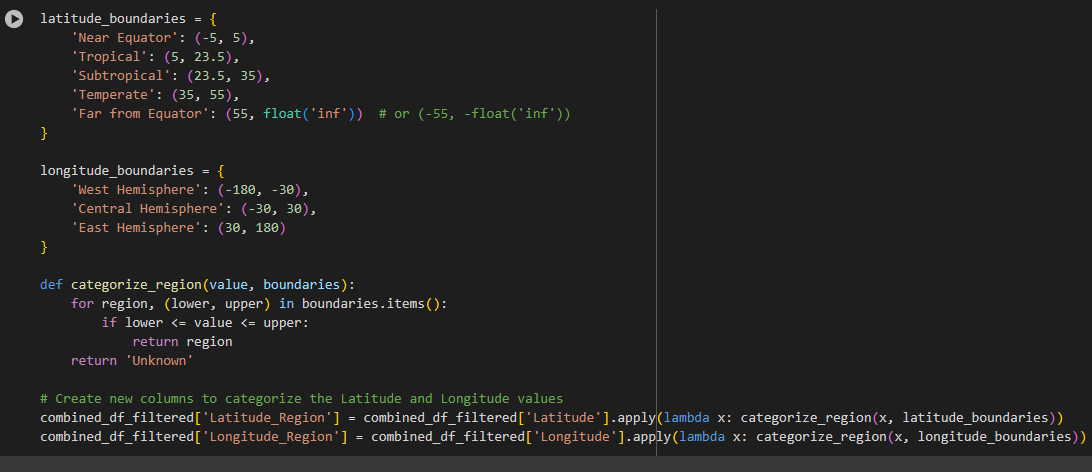
- I proceeded with feature engineering by creating new columns or grouping my data that would be useful for my analysis.
- For example, I grouped the population of urban and rural areas into percentage format, to better understand the distribution of population across different regions.
- Additionally, I grouped by langitude and longitude with its measure into like tropical, sub-tropical, temperate, equator, west hemisphere, etc.

3. Pearson Correlation Testing

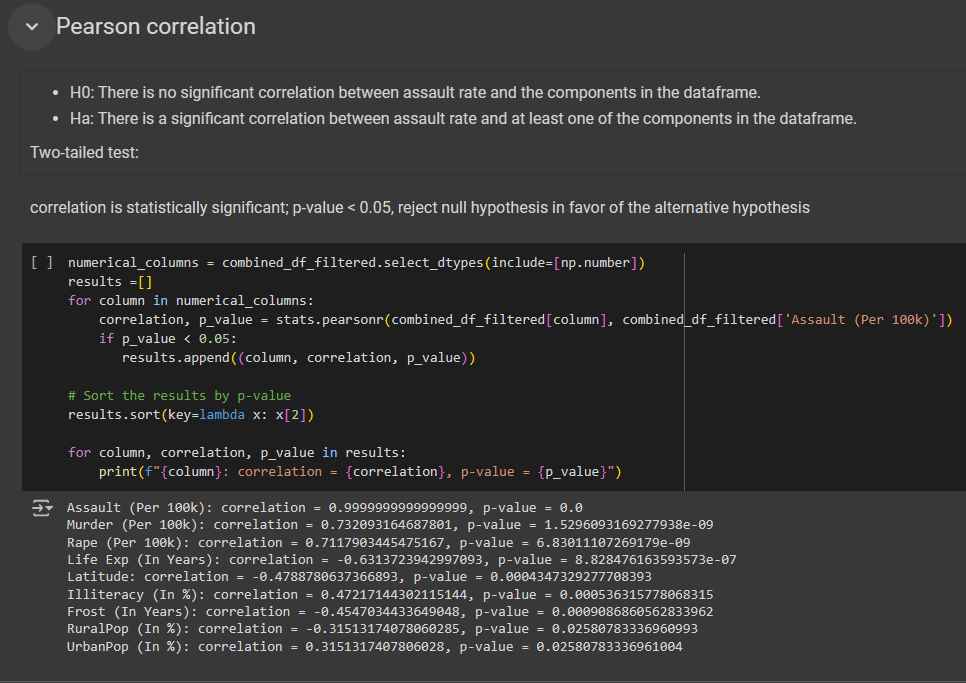
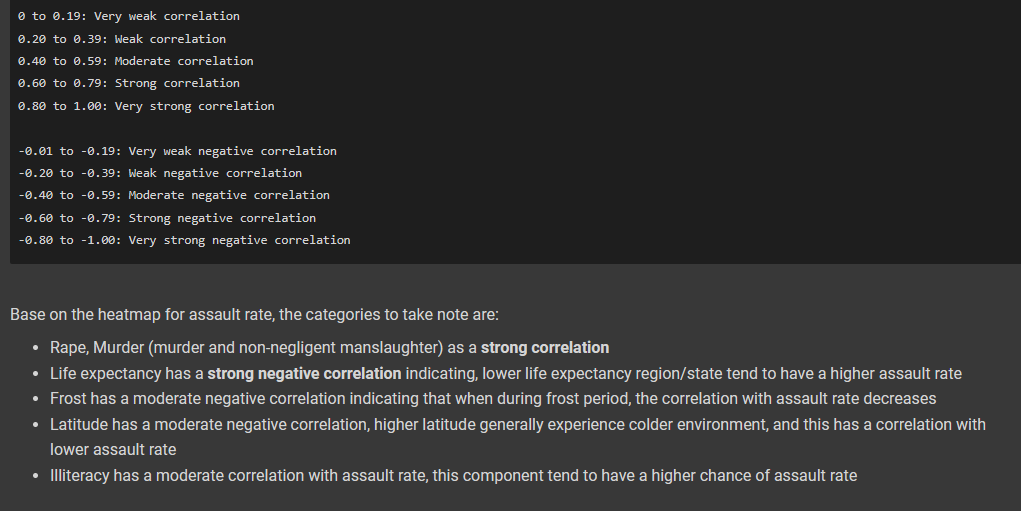
- Lastly, through the implementation of the pearson correlation, I was able to identify my null hypothesis, and alternative hypothesis. With pearson correlation (p-value), I was able to find out which variables are linearly-statistical significant to assault crime rate.
- Additionally, a heatmap was generated to visually inspect the correlation between all variables.

4. Conclusion
